Minku Koo , Jiyong Park , Hyunmoo Lee and Giseop Noh
Development of Automatic Conversion System for Pipo Painting Image Based on Artificial Intelligence
Abstract: This paper proposes an algorithm that automatically converts images into Pipo, painting images using OpenCV-based image processing technology. The existing "purity," "palm," "puzzling," and "painting," or Pipo, pain-ting image production method relies on manual work, so customized production has the disadvantage of coming with a high price and a long production period. To resolve this problem, using the OpenCV library, we developed a technique that automatically converts an image into a Pipo painting image by designing a module that changes an image, like a picture; draws a line based on a sector boundary; and writes sector numbers inside the line. Through this, it is expected that the production cost of customized Pipo painting images will be lowered and that the production period will be shortened.
Keywords: Computer Vision , Image Processing , OpenCV , Pipo Painting
1. Introduction
Pipo from “Pipo painting” is a term created by combining the first letters of “purity,” “palm,” “puzzling,” and “painting.” Pipo painting is a type of do-it-yourself painting kit. It refers to a canvas where the line of the picture is drawn, and the color number is written inside the line [1]. Pipo painting involves drawing masterpieces or famous images, or drawing images of individual interest, and it remains a famous hobby. As the non-face-to-face market has developed due to coronavirus disease 2019 (COVID- 19), which occurred in January 2020, the number of people who naturally enjoy Pipo painting has increased. Fig. 1 shows the manufacturing process of the actual Pipo painting product. Existing Pipo painting products can easily be purchased, but if the image that consumers desire is produced as a Pipo painting product, it is handmade, so the product cost increases, and the production period is prolonged. This makes the painting less accessible to consumers. To solve this problem, software was developed that automatically converts an image into a Pipo painting image.
Fig. 1.

The existing Pipo painting production method has a disadvantage in that a person has to convert the image directly. Because companies that sell customized Pipo painting products in the actual market specify that the manufacturing process is manual, they warn that it will take about two weeks for actual consumers to receive their products. This research team purchased an actual product to confirm this. The product ordered on July 16, 2021, was received on August 16, 2021. In fact, it took 31 days longer than the 2 weeks of warning. In addition, the price of the product was more than $80 because it was produced manually. Therefore, the product’s accessibility for consumers is not good. Pipo painting divides the boundaries of a picture with lines and constructs unit sections, like a puzzle. Each section is assigned a unique color.
In this paper, the starting Pipo painting picture consisting of colored unit areas is defined as the base figure (BF). A BF should be assigned a color similar to that of the original image. Creating a BF is an important task that determines the completeness of a picture when a Pipo painting is completed. Therefore, BF creation work requires considerable know-how and experience. The work of finding the most suitable paint color for the image tends to be classified into expert areas. Therefore, the disadvantage of Pipo paintings is that non-experts cannot easily produce them. In this study, a system was developed that can automate all manual tasks, such as painting, border extraction, and color selection, which are part of the existing process of Pipo painting.
2. System Design
In this study, a Pipo painting image was automatically created through a total of six steps. The entire algorithm representing the techniques used in each step is shown in Fig. 2.
2.1 Sectorization
Sectorization is a concept suggested in “performance of multi-antenna features and configurations” that divides an area into several to increase the multi-connection efficiency of a multi-antenna. In this paper, the task of dividing an original image into multiple areas is defined as sectorization [2]. Sectorization is required to change the initial original image into a picture. A blur filter was applied to simplify the numerous colors included in the image, and a bilateral filter characterized by keeping the edges of the image clear was applied [3]. In this case, to adjust the degree of blur according to the image size, the number of horizontal (W) and vertical (H) pixels of the image are calculated to compute an image size variable for parameter adjustment according to the image size. The imageSize variable is the value obtained by dividing the square root of the value multiplied by W and H by 100 and then truncating the remainder.
The sigmaColor and d values among the bilateral filter parameters were set using the imageSize value. sigmaColor defines the standard deviation of the filter in the three-dimensional color space, and the larger the value, the greater the influence of neighboring pixels and the reference color. d represents the number of pixels used for filtering [3]. At this time, as the value of sigmaColor increases, the greater the image blurring effect. In this study, the value of sigmaColor was set as the default value of 10, which is greater than the value of less than 10, which warns that the blurring effect is not great. At this time, to increase the intensity of the blur effect according to the image size, the pre-calculated imageSize value was added to the sigmaColor value. d was set to -1 so that the recommended value was automatically set according to the sigmaColor value. If the value of sigmaColor increases above a certain level, it takes a long time to work, and the image is excessively deformed, which may blur the boundaries of the colors in the image. Therefore, 150, which is the appropriate maximum level of the sigmaColor value warned in the OpenCV official document, was set as the maximum value, and the smallest of the sigmaColor value and the 150 calculated in this study was set as the final sigmaColor value [4,5].
2.2 Color Clustering
Blur-processed images go through a color clustering process. In general, more than hundreds of thousands of colors are in an image, and the K-means clustering algorithm is applied to reduce all colors to k colors. The K-means algorithm is a type of unsupervised learning that sets or classifies the input data into a specific number of clusters that the user determines through repetitive optimization techniques. It is commonly used in the field of image processing due to offering a simple and fast calculation speed [6,7]. The time complexity of the K-means algorithm is expressed as O(nkdi). n is the number of d-dimensional vectors, k is the number of clusters, d is the number of dimensions, and i is the number of repetitions [7]. The higher the number of iterations i for obtaining the best performance result by clustering based on different initial centroids, the higher the accuracy, but the disadvantage is that the time complexity increases. However, even if the number of repetitions was increased, the visual difference in the resulting image was insignificant, so it was set to one [8]. In this case, the result may appear completely different depending on the method of setting the initial central. To compensate for these shortcomings, this study involved using the K-means++ algorithm as the initial centroid setting method. The K-means++ algorithm is an improved algorithm designed to enhance the accuracy of the K-means algorithm, which is widely used among clustering-based algorithms.
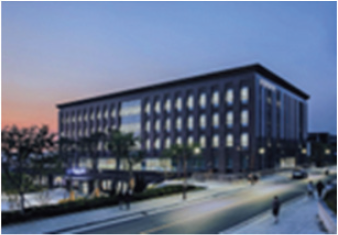
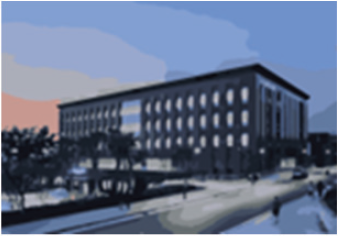
Although it takes more time to calculate than a random designated method does, it is guaranteed to find an optimal solution by distributing the center of the cluster widely [9,10]. A new image was created by reducing the color of the entire image to k through K-means clustering. Fig. 3(a) is the original image, and Fig. 3(b) and 3(c) are the regenerated image results from reducing the color by setting k to 8 and 32, respectively.
2.3 Sector Expanding
It is necessary to expand the image to increase the accuracy of the drawing sector boundary and the insert sector number modules, as well as to improve the quality of the resulting image. In this case, when the image is expanded with a fixed magnification according to the size of the original image, the image will still be small or too large. Therefore, it is necessary to vary the expansion magnification according to the image size.
Fig. 3.

The unit used for image printing is DPI, which indicates the number of dots per one inch of actual size. At this time, the average size of canvases sold on the market is 19.68 inches. When a canvas is being printed, the recommended pixel value can be calculated by multiplying the DPI by the length (inches) of the canvas to be printed. Based on the 200 DPI mainly used in commercial products, the recommended pixel value is 3,937 pixels when one is multiplying the length of the canvas (19.68 inches). Therefore, the image should be resized to a value larger than 3,937 pixels. The minimum magnification was calculated to make the smallest of the horizontal and vertical sizes of the image more than 4,000 pixels.
The interpolation method is applied for expanding the image. The image interpolation technique is an image processing technique that is widely used not only to convert low-resolution images into high-resolution images but also to zoom in on certain parts and scan medical images, such as with computed tomography and magnetic resonance imaging [11]. Regarding the image interpolation method used in this study, bilinear interpolation aimed at maintaining and expanding the line of the image in the image expansion was used. Bilinear interpolation is a technique in which one-dimensional linear interpolation is continuously applied in the horizontal and vertical directions. It is a method of predicting a pixel value at an arbitrary position between two pixels, with a straight value connecting the sizes of the adjacent left and right pixel values [12].
As the image expands, the human eye sees the same image as before, but in reality, tens of thousands of new colors are created. Because a line is drawn based on the color boundary, it is necessary to merge the newly created colors with the existing k colors. In k color RGB lists, each color is called (r1,g1,b1), respectively, and the RGB values of the pixels to be currently calculated are called (r2,g2,b2), respectively. In this case, when the color vector distance between the existing pixel color and one of the k colors is v, the process of obtaining v can be expressed by Eq. (1).
When the color vector distance is calculated with the RGB value, several colors having the same vector distance may be obtained. For example, when the RGB value of an existing color is (10, 20, 30), the vector distance between two colors (5, 20, 35) and (15, 15, 30) is the same. To solve this problem, when two or more indexes have the same vector distance calculated through Eq. (1), the hue, saturation, value (HSV) values of the color are compared as the second condition. First, convert the RGB values to HSV values. HSV is one of the color expression methods for specifying a specific color using the coordinates of the hue, saturation, and brightness [13]. The HSV value is also obtained by calculating the vector distance between the HSV values to find the minimum value. When the two HSV values are (h0,s0,v0) and (h1,s1,v1), the vector distance of the HSV value can be obtained through the following Eq. (2).
(2)
[TeX:] $$\begin{gathered} d h=\min (|h 1-h 2|, 360-|h 1-h 0|) \div 180.0 \\ d x=|s 1-s 0| \\ d v=|v 1-v 0| \div 255.0 \\ \text { distance }=(d h \times d h+d s \times d s+d v \times d v)^2 \end{gathered}$$The image sectorization process is blurring the original image and then clusters the colors into k. After that, the image is expanded, and the new color created in the process is wrapped with one of the k colors by calculating the distance between the existing k colors and the color vector.
2.4 Drawing Sector Boundary
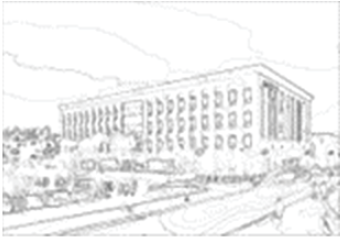
After reducing the color to k through color clustering in the original image, draw a line based on the boundary line where the sector color is changed in the converted image, as shown in the picture. In this paper, the boundary where the sector color of the image changes is defined as the sector boundary. When all pixels in the image are compared, all pixels with different colors from the adjacent pixels are converted to black so that the lines do not break. At this time, as the thickness of the line increases, it becomes difficult to paint the final result image —for instance, a section where the line overlaps or the area inside the line decreases—so all lines are drawn to the thickness of one pixel. When two lines are compared, all pixel indexes with different RGB color values of adjacent pixels are obtained. At this time, the horizontal and vertical directions of the image are compared to obtain all pixel locations with different colors from adjacent pixels. After the pixel position is calculated, all the pixels are changed to RGB (0, 0, 0) and converted to black. Thereafter, the three-dimensional image is converted to a two-dimensional image by converting the image to black and white. Fig. 4 shows the image drawn by changing the color to black based on the sector boundary.
2.5 Finding Sector Incenter
Write a color number at a specific position in the inner space of the line. At this time, find the inscribed circle that is tangent to all boundaries of a specific sector, and write a number in the incenter, the center of the inscribed circle. The existing definition of an inscribed circle is a circle that is tangent to all sides of a polygon, but in this paper, a circle with a maximum area that can be drawn inside a specific sector is defined as an inscribed circle. In this case, if no line is present at the outermost part (edge of the image), the incenter cannot be obtained. Therefore, as the last process of the module in this study, an arbitrary line was drawn on the edge of the image to increase the accuracy so that numbers were written on all sectors in the color numbering process. If the color boundary line has been extracted from the painted image, the color number is now written inside the color boundary line. At this time, the color number is the number of the paint that the user will paint inside the picture. The user receives the drawing, checks the color number written inside the sector, and selects the paint to be painted. The color number writing task involves writing the color index by detecting the color of each sector of the input image.
A preprocessing step is required before color numbering. All colors of the image to be worked on should be extracted, and the index should be matched 1:1 with each color. Read the image to be worked on pixel by pixel, and get the blue, green, red (BGR) color value of each pixel. Thereafter, duplicates are removed from the corresponding BGR value. In this case, the color number uses the BGR values as the indexes counted from 1 in order. The algorithm is shown in Fig. 5.
For detecting the color inside the contour, the color space of the image must be converted to CIE L*a*b* format. CIE L*a*b* is a non-linear transformation of the color space that the International Commission on Illumination (CIE) established in 1931. The L* value represents brightness, a* represents red and green, and b* represents yellow and blue. The CIE L*a*b* color space was defined based on research on human vision, independent of the medium, unlike RGB [14].
The process of converting the RGB color space to the CIE L*a*b* color space is as follows [14]. Since RGB cannot be converted to CIE L*a*b* directly, we convert RGB to intermediate color space called “XYZ” established in CIE in 1931 using Eq. (3).
(3)
[TeX:] $$\begin{gathered} {\left[\begin{array}{l} X \\ Y \\ Z \end{array}\right] \leftarrow\left[\begin{array}{lll} 0.412453 & 0.357580 & 0.180423 \\ 0.212671 & 0.715160 & 0.072169 \\ 0.019334 & 0.119193 & 0.950227 \end{array}\right] \cdot\left[\begin{array}{l} B \\ G \\ R \end{array}\right]} \\ X \leftarrow \frac{X}{X_n}, \text { where } X_n=0.950456, \\ Z \leftarrow Z / Z_n, \text { where } Z_n=1.088754 \end{gathered}$$By using XYZ, we compute L*a*b* values under the process of Eq. (4).
(4)
[TeX:] $$\begin{gathered} L^* \leftarrow\left\{\begin{array}{cc} 116 * Y^{\frac{1}{3}}-16 & \text { for } Y \gt 0.008856 \\ 903.3 * Y & \text { for } Y \leq 0.008856 \end{array}\right. \\ a^* \leftarrow 500(f(X)-f(Y))+\delta \\ b^* \leftarrow 200(f(Y)-f(Z))+\delta \end{gathered}$$The converting function f(x) and constant are given by Eq. (5).
(5)
[TeX:] $$\begin{gathered} f(t)=\left\{\begin{array}{cc} t^{\frac{1}{3}} \quad \text { for } t \gt 0.008856 \\ 7.787 t+\frac{16}{116} \quad \text { for } t \leq 0.008856 \end{array}\right. \\ \text {and} \\ \delta=\left\{\begin{array}{cl} 128 & \text { for } 8-\text { bit images } \\ 0 & \text { for } \text { floation }- \text { point images } \end{array}\right. \end{gathered}$$The binarized color cluster image is the result of Eqs. (3)–(5). In the binary image, a hierarchy list expressing the hierarchical relationship of the contour list is additionally created. The pseudocode of the work is shown in Fig. 6.
In Fig. 6, line 4 can receive either the entire contour or only the boundary box coordinates, depending on the user setting. In this paper, findContours of OpenCV is used to implement the algorithm (Fig. 6). In this paper, the tree shape was confirmed using RETR_TREE provided by OpenCV. findContours is used as a method for extracting the correlation of the contour.
Contours are intricately intertwined with one another. Therefore, when the color number is written, if the child contour is located at the coordinates where the color index is written, they may overlap each other. To solve this, the masking operation is required for all children inside the contour.
The index of the parent contour is written at the fourth index of each element of the hierarchy variable. Fig. 7 is the output of the hierarchy of the structure generated through the algorithm (Fig. 6) [15]. The fourth argument for each item (Fig. 7(d)) represents the index of the parent contour. If the parent contour does not exist, it is denoted as -1. At this time, if the fourth argument (Fig. 7(d)) extracts the same elements as the current contour, all children who are overlaid inside the contour can be extracted. All extracted children are represented in an array format.
Fig. 8.

The masking operation first creates an image of the same size as the image (Fig. 8(a) and 8(b)). After the current contour boundary is drawn in white (Fig. 8(c)), painting the child contours in black completes the masking operation (Fig. 8(d)). At this time, the white area is the area of the pure contour excluding the child area outside and inside the contour. Now, we need to determine the coordinates where the color index will be written inside the contour. The coordinates to be written are at the incenter of the corresponding contour. The reason why it should be the incenter instead of the center of gravity is that the center of gravity is located outside the contour depending on the shape of the contour. An example of an inscribed circle and an incenter is the red circle and red dot in Fig. 8(e). The pseudo code is shown in Fig. 9.
An example of the image as a result of executing code line 1 in the pseudocode of Fig. 9 is shown in Fig. 10. The original sample image is an image of several Trump cards on a flat surface. Fig. 10 is an image representing the color value that is proportional to the distance value away from each black boundary of the contour [16].
2.6 Insert Sector Number
This study’s research team measured the width of the smallest brush on the market and confirmed that the radius was 1 mm. Also, the minimum pixel in the picture tailored to the typical canvas size of 50 cm described in 2.3 is 4000 pixels, and the ratio is 8 pixels per 1 mm. If the radius of the inscribed circle returned for each contour is less than 8 pixels, it is difficult to paint with a brush, so it is not reflected in the result.
The coordinates at which the color index is to be written are at the incenter. The reason for this is that when an index is written in the sector’s center of gravity, the writing position may deviate from the sector area in a special shape, such as a crescent shape or a donut shape. This problem violates the rule of Pipo painting, which requires coloring inside the area. On the other hand, in the case of the incenter, the coordinates are always located inside the sector regardless of the shape of the sector, and the case where the number is generated close to the boundary line can be avoided. If the number is located close to the boundary line, it may overlap the line, making it difficult to identify the number, and the readability will decrease when the user views the drawing.
For the final result image to be produced, a blank image of the same size as the input image must be created. The result image is created by writing the contour boundary line and color indexes for the blank image. Creating a blank image is created by allocating 255 for each pixel to a blank image of the same size as the image to be worked on. In this case, 255 is the maximum value of the color range of 0 to 255, and it corresponds to white. Then, draw the contours of the picture in the generated white image. To extract the inner color index of each contour, use the L*a*b* color space image created above. First, the outside of the contour in the L*a*b* image is painted in black to perform masking, and the average value of the inside color of the contour is extracted. After that, using the Euclidean distance calculation formula (Eq. 6), find the index of the color value closest to the internal average value in the L*a*b* image color value, and write it in the inner coordinates.
In Eq. (6), p is point p (p1, p2, ..., pn) expressed in an orthogonal coordinate system, and q represents q (q1, q2, ..., qn) like p [17]. The above operation is performed for all contours. For the user to check the color and the color index of the paint, the result is displayed in a legend format. At this time, the position of the legend is the upper left corner of the image (20 pixels from leftmost and 40 pixels from topmost). Write down the color index first, and draw a rectangle painted with the color on the right side of the color index.
An example of the results drawn through the above legend work is shown in Fig. 11. This figure is part of the entire legend (indexes 6 to 9). It can be seen that the rectangle is located with the color corresponding to each color index. The user can check the corresponding color number to check the color that matches the paint number.
The image in which all color numbering has been completed is shown in Fig. 12. This figure shows the result of completing all work procedures of this algorithm for the original image corresponding to Fig. 1. At this time, because the legend function is disabled, the color number index is not visible in the upper left corner. The lower right image in Fig. 12 is an enlarged part of the resulting image. It can be seen that the color number is written at the inner position of each contour area.
3. Experimental Results
We conducted a comprehensive experiment by combining all the previous processing on Pipo painting. The experimental set-up is summarized in Table 1.
The sample image used for the test purpose, ‘la-la-land’, has the information of Table 2.
Table 1.
| Experimental setup | Description | |
|---|---|---|
| Hardware | Mainboard | MSI B360M |
| CPU | Intel Core i5-9400F CPU @ 2.90 GHz | |
| GPU | NVIDIA GeForce RTX 2070 SUPER | |
| RAM | DDR4 24 GB | |
| Software | OS | Window 10 Pro, 64 bit, 21H2 |
| Python | 3.8.10 | |
| Flask | 1.1.2 | |
| cv2 | 4.5.1 | |
| Numpy | 1.20.1 | |
Table 2.
| Format | Width (pixel) | Height (pixel) | Bit | Size | |
|---|---|---|---|---|---|
| Input | .png | 910 | 1,024 | 24 | 0.97 MB |
| Output | .png | 2,730 | 3,072 | 24 | 810 kB |
To validate the performance of our approach, we conducted experiments with two more images. The experimental results are portrayed in Table 3, which explain and show how input images are processed for each main process. Since the space is limited, we show the process of 16 color reduce in Table 3 even we conducted 8-, 16-, and 32-color clustering.
4. Conclusion
This study proposes a method for automatically changing the original image to a Pipo painting canvas image using OpenCV-based image processing technology. For transforming the initial image, like a picture, after blur processing, an image clustered into k colors is generated using the K-means algorithm. Afterward, the pixel whose color is changed in the image is changed to black, a line is drawn, and then, it is converted to a two-dimensional image. Analyze outlines and hierarchical relationships in the line-drawn image. Find the sector incenter, remove the overlapping area, and write the color index number to create the final result.
Pipo painting is naturally attracting attention as a popular leisure activity due to the revitalization of the non-face-to-face market following COVID-19. If the technology development through this study is used in the actual manufacturing process of customized products, the price of the product can be lowered. Through this technology, it is expected that Pipo painting will become popular, and the accessibility of this technology for the socially underprivileged, such as in the form of group art therapy for dementia patients, will increase. As our future works, the automated computing approach on the mixing ratio of paint is needed since we only provide color images and color codes. Additionally, enhancing the algorithm, finding sector incenter (Algorithm 3 in Section 2.5), will improve overall processing time.
Biography
Giseop Noh
https://orcid.org/0000-0003-2630-3723He received a B.S. degree in industrial engineering at R.O.K. Airforce Academy in 1998, an M.S. degree in computer science at University of Colorado in 2009, and a Ph.D. degree in computer Engineering at Seoul National University in 2014. He is currently a professor in the Department of Software Convergence, Cheongju Univer-sity, Cheongju, Korea. His research interests include artificial intelligence, natural language processing, and recommender systems.
References
- 1 T. Pandina Scot, C. M. Callahan, and J. Urquhart, "Paint-by-number teachers and cookie-cutter students: the unintended effects of high-stakes testing on the education of gifted students," Roeper Review, vol. 31, no. 1, pp. 40-52, 2008.doi:[[[10.1080/02783190802527364]]]
- 2 H. Asplund, D. Astely, P. von Butovitsch, T. Chapman, and M. Frenne, "Performance of multi-antenna features and configurations," in Advanced Antenna Systems for 5G Network Deployments. Amsterdam, Netherlands: Academic Press, 2020, pp. 561-637.doi:[[[10.1016/B978-0-12-820046-9.00013-7]]]
- 3 C. Tomasi and R. Manduchi, "Bilateral filtering for gray and color images," in Proceedings of the 6th International Conference on Computer Vision (IEEE Cat. No. 98CH36271), Bombay, India, 1998, pp. 839846.doi:[[[10.1109/iccv.1998.710815]]]
- 4 OpenCV , "Smoothing images," 2022 (Online). Available: https://docs.opencv.org/4.5.2/d4/d13/tutorial_py_f iltering.html.custom:[[[https://docs.opencv.org/4.5.2/d4/d13/tutorial_py_filtering.html]]]
- 5 OpenCV , "Image filtering," 2023 (Online). Available: https://docs.opencv.org/3.4/d4/d86/group__imgproc_ _filter.html.custom:[[[https://docs.opencv.org/3.4/d4/d86/group__imgproc__filter.html]]]
- 6 C. G. Woo, K. H. Park, and Y . H. Kim, "Shadow area detection based on Slic Superpixel and K-mean algorithm," Proceedings of KIIT Conference, vol. 2019, no. 6, pp. 1-3, 2019.custom:[[[-]]]
- 7 Wikipedia, "K-means clustering," 2023 (Online). Available: https://en.wikipedia.org/wiki/K-means_clustering.custom:[[[https://en.wikipedia.org/wiki/K-means_clustering]]]
- 8 OpenCV , "K-means clustering in OpenCV ," 2021 (Online). Available: https://docs.opencv.org/4.5.2/d1/d5c/ tutorial_py_kmeans_opencv.html.custom:[[[https://docs.opencv.org/4.5.2/d1/d5c/tutorial_py_kmeans_opencv.html]]]
- 9 D. Arthur and S. V assilvitskii, "k-means++: the advantages of careful seeding," in Proceedings of the 18th Annual ACM-SIAM Symposium on Discrete Algorithms (SODA), New Orleans, LA, 2007, pp. 1027-1035.custom:[[[https://dl.acm.org/doi/10.5555/1283383.1283494]]]
- 10 S. W. Lee, "Fast search algorithm for determining the optimal number of clusters using cluster validity index," The Journal of the Korea Contents Association, vol. 9, no. 9, pp. 80-89, 2009.doi:[[[10.5392/jkca.2009.9.9.080]]]
- 11 F. A. Jassim and F. H. Altaany, "Image interpolation using kriging technique for spatial data," Canadian Journal on Image Processing and Computer Vision, vol. 4, no. 2, pp. 16-21, 2013.custom:[[[https://arxiv.org/pdf/1302.1294.pdf]]]
- 12 D. Kim, "Adopting and implementation of decision tree classification method for image interpolation," Journal of Korea Society of Digital Industry and Information Management, vol. 16, no. 1, pp. 55-65, 2020.custom:[[[http://koreascience.kr/article/JAKO202009863559719.pdf]]]
- 13 Wikipedia, "HSL and HSV ," 2023 (Online). Available: https://en.wikipedia.org/wiki/HSL_and_HSV .custom:[[[https://en.wikipedia.org/wiki/HSL_and_HSV]]]
- 14 Wikipedia, "CIELAB color space," 2021 (Online). Available: https://en.wikipedia.org/wiki/CIELAB_color _space.custom:[[[https://en.wikipedia.org/wiki/CIELAB_color_space]]]
- 15 OpenCV , "Contours hierarchy," 2021 (Online). Available: https://docs.opencv.org/4.5.2/d9/d8b/tutorial_py_ contours_hierarchy.html.custom:[[[https://docs.opencv.org/4.5.2/d9/d8b/tutorial_py_contours_hierarchy.html]]]
- 16 OpenCV , "Image segmentation with distance transform and watershed algorithm," 2021 (Online). Available: https://docs.opencv.org/3.4/d2/dbd/tutorial_distance_transform.html.custom:[[[https://docs.opencv.org/3.4/d2/dbd/tutorial_distance_transform.html]]]
- 17 Wikipedia, "Euclidean distance," 2023 (Online). Available: https://en.wikipedia.org/wiki/Euclidean_distance.custom:[[[https://en.wikipedia.org/wiki/Euclidean_distance]]]


